

Benford Analysis in Audit Analytics
Benford analysis (also: analysis according to Benford's law) is a mathematical-statistical method used in financial auditing to detect irregularities in accounting data. The underlying principle is as simple as it is effective: in naturally occurring data sets, the leading digits of amounts follow a specific, predictable distribution. If the actual distribution deviates significantly from this expectation, this is an indication of possible data manipulation or systematic errors.
Benford's law – mathematical background
Named after the physicist Frank Benford, the law describes the distribution of leading digits in numerical data sets. Contrary to the intuitive assumption that every digit should be equally likely to appear as the leading digit, reality shows a very different picture: the digit 1 appears as the first digit in about 30.1 percent of all cases, the digit 2 in around 17.6 percent, while the digit 9 leads in only about 4.6 percent of cases.
Mathematically, this distribution is described by the formula P(d) = log10(1 + 1/d), where d is the leading digit. This law applies to a wide range of data sets, including population figures, physical constants, stock prices – and also accounting data from financial accounting.

Prerequisites and suitability
Benford analysis is particularly suitable for data sets that meet certain prerequisites. The data should be spread across several orders of magnitude, should not be restricted by fixed upper or lower limits and should originate from naturally occurring processes. In financial auditing, typical applications are the analysis of journals, invoice amounts, account movements, cash books and accounts payable and receivable balances.

The method is less suitable for data sets with narrow value ranges (such as standardized fees or fixed prices), for very small samples or for data determined by external specifications. The auditor must therefore assess the suitability of the data set before applying it.
Benford analysis unfolds its full potential with large, diverse data sets. Journals with several thousand entries are an ideal field of application.
Analysis variants: first, second and first two digits

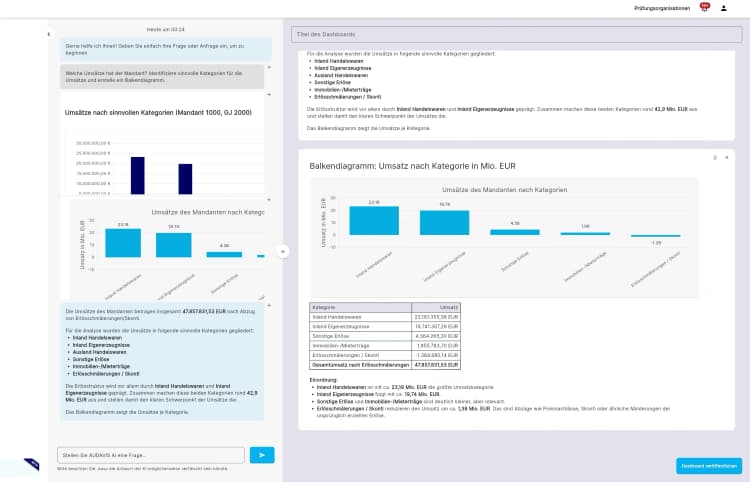
The figure shows a Benford analysis dashboard directly in AUDAVIS (https://app.audavis.io).
In addition to the classic first-digit analysis, extended variants are available. Second-digit analysis can uncover more subtle manipulations, as the second digit is often overlooked in deliberate falsifications. The combination of first and second digits results in a distribution across 90 possible combinations (10 to 99) and enables a much finer analysis. There are also extensions for the last digits, which can point to deliberate rounding or manipulation of amounts.
Interpreting the results
The results of a Benford analysis are usually presented as a comparison between the observed and the expected digit distribution. Various tests are used to evaluate the deviations statistically, including the chi-square test, the mean absolute deviation (MAD) and the Z-test for individual digits.
It is important to understand that a significant deviation from Benford's law does not in itself prove fraud. Rather, it indicates that certain areas of the accounting data require closer examination. The deviation may also be caused by operational characteristics of the company, by fixed price structures or by seasonal effects. The auditor uses the results as a starting point for targeted audit procedures.
Benford analysis as a risk assessment tool
As part of audit planning, Benford analysis can provide valuable input for the risk assessment. It enables an efficient initial assessment of the accounting data and helps direct the audit focus to those areas where conspicuous patterns occur. Benford analysis is an established and scientifically sound tool, especially for identifying fraud risks.
Combined with other data analytics methods – such as duplicate analysis, journal entry testing or risk scoring – it forms a comprehensive analytical toolkit that effectively supports the auditor in assessing the integrity of the accounting data.
AUDAVIS integrates Benford analysis as a standard audit procedure and visualizes deviations in interactive working papers – for a systematic and data-driven risk assessment.
Learn more at www.audavis.ai
AUDAVIS – the AI platform for financial statement audits. Automated working papers, risk analyses and intelligent data analytics for auditors.
Would you like to audit analytically too? Feel free to sign up here for a demo.

AUDAVIS - KI-gestützte Dokumentation für die Abschlussprüfung
AUDAVIS bietet ab 2027 die vollwertige Dokumentation der Abschlussprüfung als Nutzer-Funktion mit KI-Unterstützung.
KI-gestützte Individual-Analysen für Prüfer

Offset Account Analysis in Financial Statement Audits
Analyzing the posting relationships between accounts and their offset accounts is one of the most revealing audit procedures in general ledger analysis.